
China.org.cn | March 14, 2023
The 2021 China Integrated City Index was recently released. Beijing tops the comprehensive ranking for the sixth consecutive year, followed by Shanghai in second place and Shenzhen in third.
"The 2021 edition of the China Integrated City Index was released as schedule with new features. The 2021 Index is quite impressive because it has newly added comparative analyses of cities from different regions and with various scales in terms of their integrated indicators, economy, environment and society. From this, we can see the attractiveness and influence of megacities, super large cities, Type-I large cities, Type-II large cities and small and medium-sized cities under the background of regional development strategies such as Beijing-Tianjin-Hebei coordinated development, the integrated development of the Yangtze River Delta, Guangdong-Hong Kong-Macao Greater Bay Area, and Chengdu-Chongqing Economic Circle. We can also get a deeper understanding of why the 20th CPC National Congress put forward the idea of changing the development pattern of megacities," commented Yang Weimin, a member of the Standing Committee of the Chinese People's Political Consultative Conference National Committee and former deputy director of the office of the Central Leading Group for Financial and Economic Affairs of China.
1. A Multimodal index evaluating China's urban development
The China Integrated City Index covers 297 Chinese cities at and above the prefecture level, and comprehensively evaluates their development from three dimensions of environment, society, and economy. Each of the three dimensions comprises three major sub-dimensions, and each major sub-dimensions comprises three indicator groups, altogether forming a 3×3×3 structure. Each indicator group is supported by multiple indexes, and these indexes are composed of 882 sets of data, of which statistical data account for 31%, satellite remote sensing data for 35%, and internet big data for 34%. In this sense, the China Integrated City Index is an advanced multimodal index system that can use data resources in different fields to gauge and judge cities in a sound way.
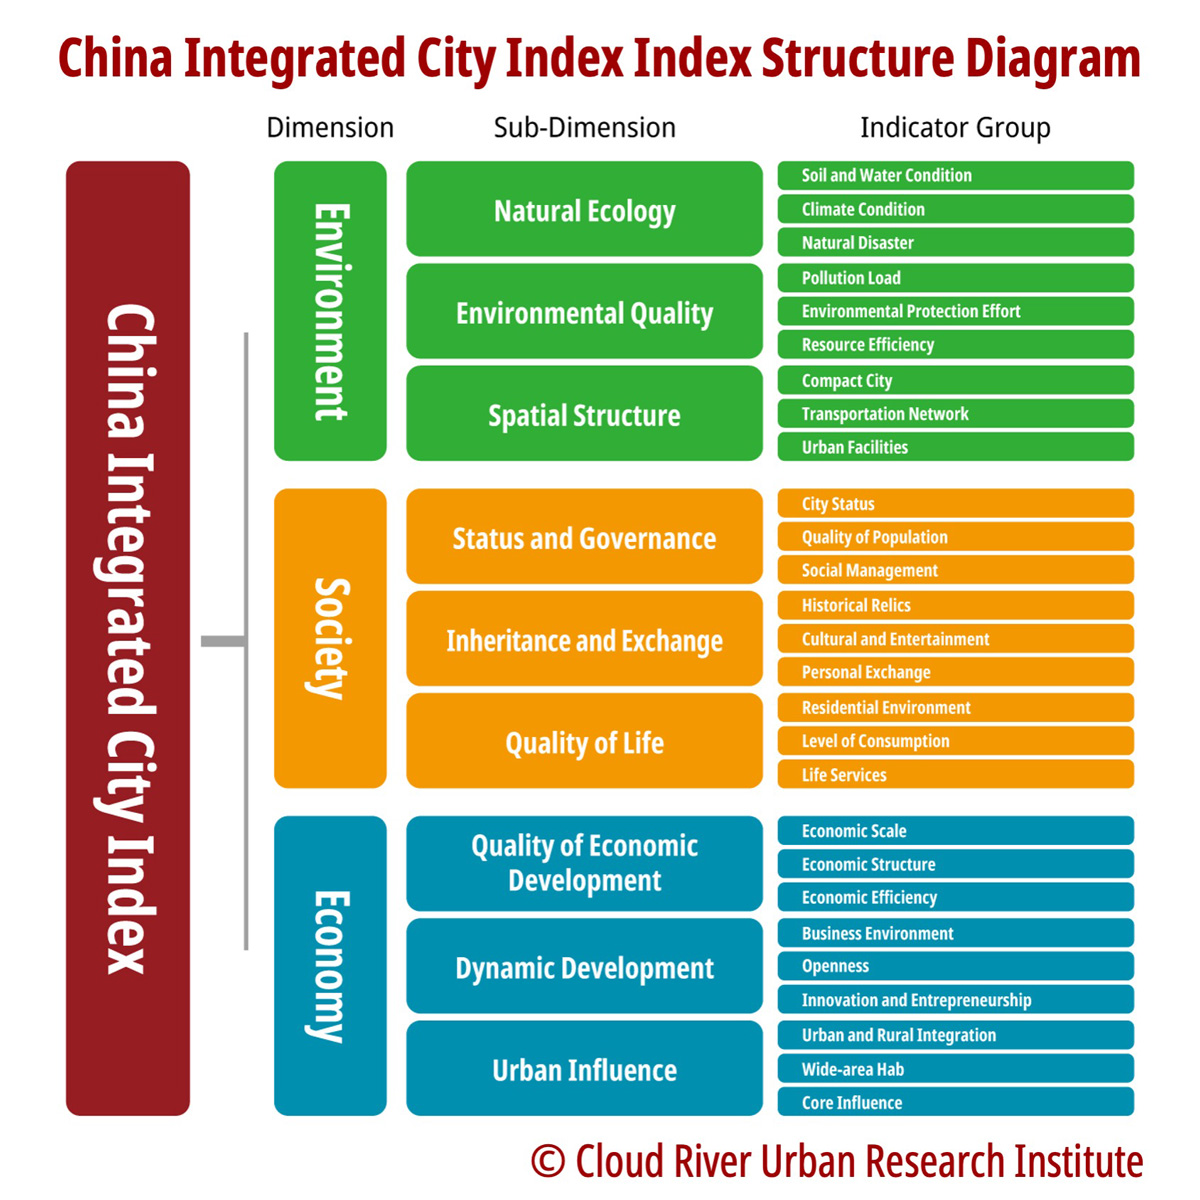
"The top 10 cities in the 2020 comprehensive ranking all make the top 10 list of the 2021 ranking. Hangzhou climbed higher from eighth to sixth. Chengdu, Hangzhou, Nanjing, Chongqing, and Suzhou stabilized their positions as new first-tier cities and have demonstrated strong momentum in their race with the older generation of first-tier cities. The Index has strong features, with nine indicators like economic aggregate, structure, efficiency, business environment and core influence comprising the economy dimension, another nine indicators like ecological and environmental protection, infrastructures, and transport network comprising the environment dimension, and social management, population quality, culture, and exchanges comprising the society dimension. The 27 indicator groups form the comprehensive evaluation of urban development. To some extent, these 27 indicators reflect China's ongoing transition from quantity-based development to high-quality development as well as the country's path to modernization. High-quality economic development cannot be achieved without high-level social development. The growth of material wealth needs to be transformed into comprehensive human development. Good social governance and educational and cultural development are the foundation and the result of high-quality development. At the same time, high-quality development is bound to create a better environment," commented Tang Jie, former vice mayor of Shenzhen and board member of the Chinese University of Hong Kong, Shenzhen (CUHK-Shenzhen).
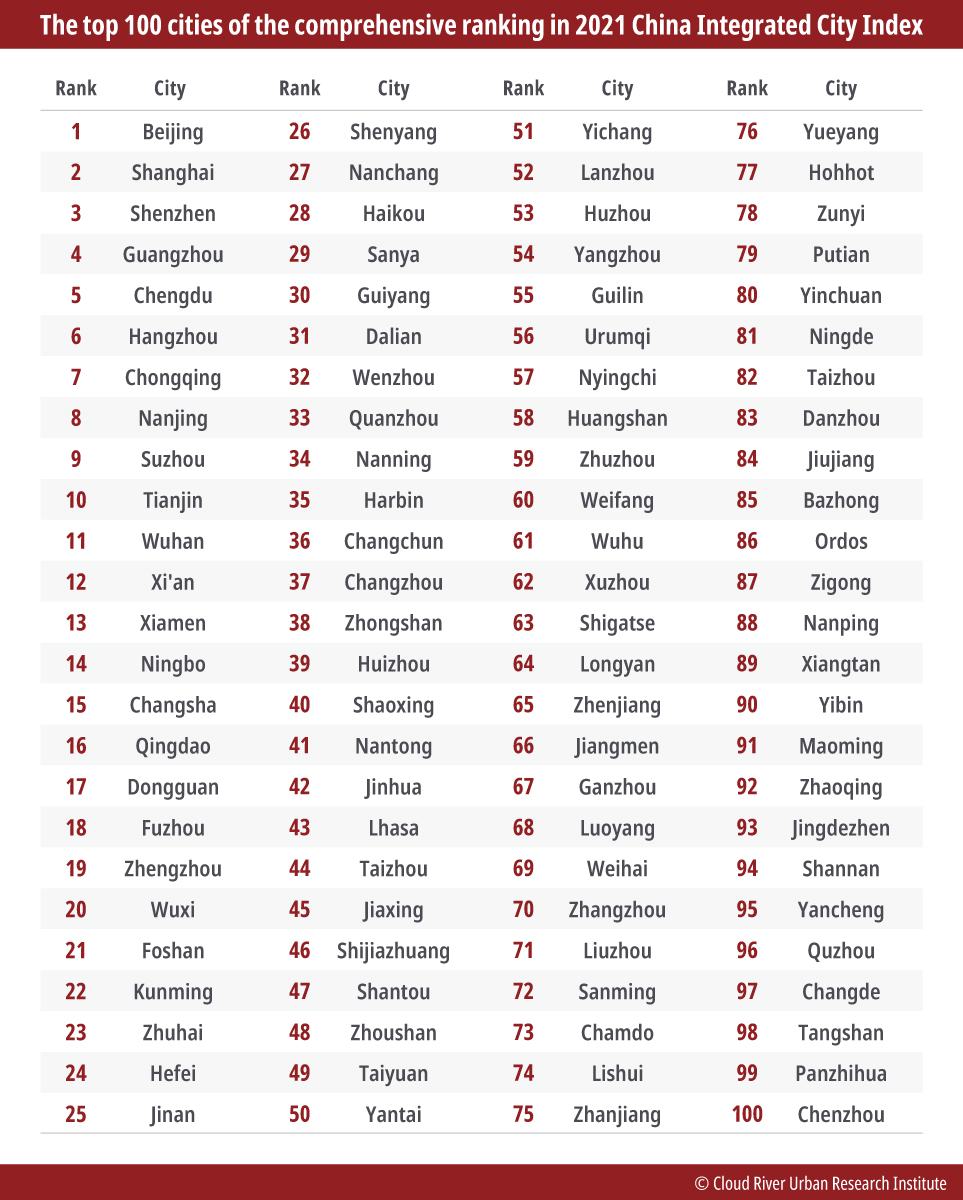
The top 10 cities in the comprehensive ranking are Beijing, Shanghai, Shenzhen, Guangzhou, Chengdu, Hangzhou, Chongqing, Nanjing, Suzhou and Tianjin. They come from four city clusters, including four in the Yangtze River Delta, two in the Pearl River Delta, two in the Beijing-Tianjin-Hebei region, and two in the Chengdu-Chongqing Economic Circle.
Places from 11th to 30th are Wuhan, Xi'an, Xiamen, Ningbo, Changsha, Qingdao, Dongguan, Fuzhou, Zhengzhou, Wuxi, Foshan, Kunming, Zhuhai, Hefei, Jinan, Shenyang, Nanchang, Haikou, Sanya and Guiyang.
Among the top 30 cities in the comprehensive ranking, 24 are core cities (There are altogether 36 core cities nationwide, including four municipalities directly under the central government, 27 capital cities of provinces and autonomous regions, and five cities with independent planning status.) In other words, nearly 70% of the core cities made the list to the top 30 ranking, demonstrating their strong comprehensive strength.
Figure 1. The top 100 cities of the comprehensive ranking in 2021 China Integrated City Index
2. Megacities and super large cities leading China's urban development
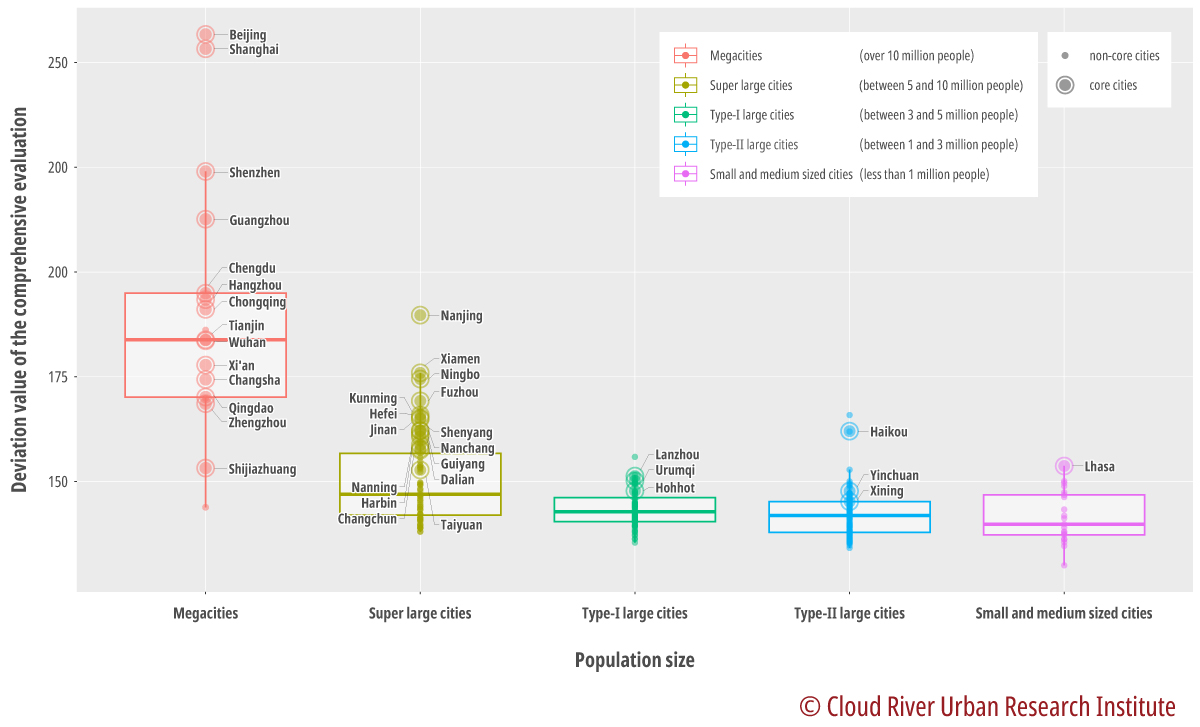
To better understand the relationship between city scale and development level, the 2021 Index uses beeswarm plots on top of boxplots to demonstrate the distribution and differences of the comprehensive evaluation of cities with various populations.
"The 2021 Index is full of surprises and innovations. Besides the rankings by different indicators, the Index uses beeswarm plots on top of boxplots to demonstrate the distribution and the level of differences among different types of cities and cities of different geographical locations. This vividly displays the general development of Chinese cities in 2021 and the development levels of cities with different size of population and geographical locations, giving readers a multidimensional and direct picture of those cities' performances. It is quite an important innovation," commented Ming Xiaodong, official of the National Development and Reform Commission, and former minister-counsellor of the Chinese Embassy in Japan.
According to population size, the "2021 Index" divides cities into the following categories: megacities with over 10 million people, super large cities with between 5 and 10 million people, Type-I large cities with between 3 and 5 million people, Type-II large cities with between 1 and 3 million people, and small and medium sized cities with less than 1 million people. This classification follows the same standard in the "Notice of the State Council on Adjusting the Standards for Urban Scale," but with the difference that the "Notice" adopts urban district population while the "Index" uses the permanent population in classifications.
Following this standard, among the 297 cities analyzed in the Index, there are 17 megacities, 73 super large cities, 107 Type-I large cities, 79 Type-II large cities and 21 medium and small sized cities, according to China's 7th National Population Census.
The permanent population of the 17 megacities has reached 270 million, which is more than twice the total population of Japan. The population of megacities and super large cities is twice the population of the United States. Professor Zhou Muzhi, head of the Cloud River Urban Research Institute, said: "More than half of China's population lives in these cities. Large-scale urbanization and population flow to megacities have become a reality in China today."
The horizontal line inside the boxplot represents the median of the sample, the top of the box represents the upper quartile (75%), and the bottom of the box represents the lower quartile (25%). The box represents the distribution of 50% of the sample. A beeswarm plot is a statistical chart used to display the distribution of individual data points. Mapping a beeswarm on top of a boxplot can simultaneously display the position of each sample and the overall distribution of the sample.
The Index applies the concept of the deviation value to reflect the position of the 297 cities against other cities in the country in each indicator. The Index uses the deviation value and converts the units adopted to a unified scale to make comparison. The national average value of the comprehensive evaluation deviation superimposed by the deviation values of the three major items, namely the environment, society and the economy, is 150. According to Figure 2, in terms of the median deviation value of the comprehensive ranking of all types of cities, only megacities surpass the national average.
Zhou Muzhi, head of Cloud River Urban Research Institute emphasized that megacities are undoubtedly the engine of China's urban development. However, he added that it is worth noting that some megacities do poorly in the comprehensive evaluation. For example, Linyi's deviation value of the comprehensive evaluation is lower than the national average. For another example, Shijiazhuang takes 46th spot in the ranking, while Nanjing, although a super large city with a population1.8 million less than Shijiazhuang, comes at 7th in the ranking.
This is because the Index is the comprehensive evaluation of the environment, society and the economy. According to the analysis of the correlation between cities' population size and their deviation value of the comprehensive evaluation, the population size is weakly related with the environment item, and relatively strongly related with the social item, and most strongly related with the economic item. That is to say, some populous cities with a strong economy may fare badly in the comprehensive ranking due to their poor performance in the environmental item.
Figure 2. Comprehensive ranking and comparative analysis of various types of cities in 2021
3. Front-runners in regional development: Eastern China and southern China
China has vast lands and its climate, geography, environment, and social development conditions all vary from region to region. The Index compares and dissects the performances of cities in seven major regions.
Figure 3. Comprehensive ranking and comparative analysis of cities in various regions in 2021
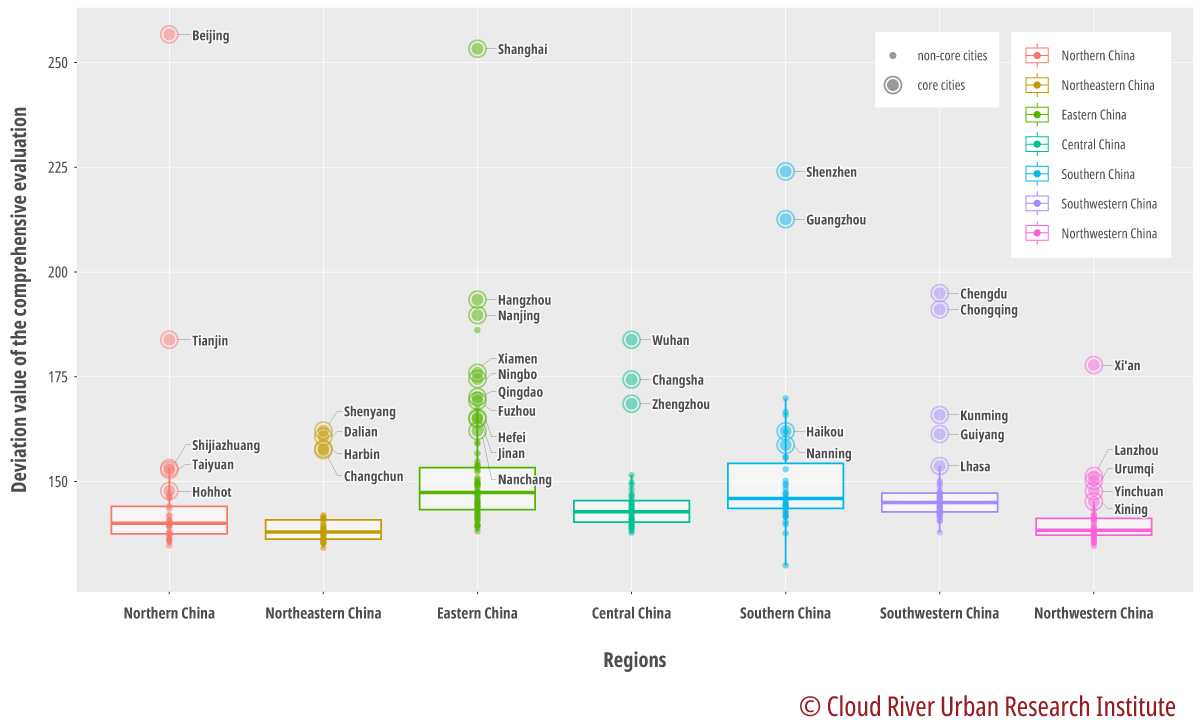
When it comes to the number and population size of cities in each region, there are 33 cities in northern China with a population of 164 million, accounting for 11.6% of the total population of the country; there are 34 cities in northeastern China with a population of 96 million, accounting for 6.8%; there are 77 cities in eastern China with a population of 425 million, accounting for 30.1%; there are 42 cities in central China with a population of 214 million, accounting for 15.1%; there are 39 cities in southern China with a population of 182 million, accounting for 12.9%; there are 39 cities in southwestern China with a population of 171 million, accounting for 12.1%; and there are 33 cities in northwestern China with a population of 79 million, accounting for 5.6%.
As Figure 3 indicates, there is no region registering a median of the deviation value higher than the national average of 150 in the comprehensive evaluation. Specifically, northern China has the lowest median and its four core cities has a mediocre performance in the comprehensive ranking and its most non-core cities are concentrate near the lowest median. Xi'an, at 12th place in the comprehensive ranking, has helped to raise the overall median level of northwestern China.
Beijing and Tianjin, in first and 10th places in the comprehensive ranking, have largely contributed to the scores of northern China, making the region's median higher than northeastern and northwestern China.
Three core cities -- Wuhan, Changsha, and Zhengzhou -- are bellwethers in central China, while Yichang is the only non-core city whose comprehensive deviation value is higher than the national average.
Eastern China, which has the highest median, has a different picture. The region has a host of core cities like Shanghai and non-core cities such as Suzhou and Wuxi, which perform very well in the ranking. As a result, the region's area of the boxplot is relatively large, showing its core cities and non-core cities work together to contribute to a high median. Southern China has a similar situation, in which core cities like Shenzhen and Guangzhou and non-core cities like Dongguan and Foshan all have a strong showing. A number of non-core cities in these two regions have become pacemakers in China's urban development.
Ming pointed out that the Index accurately reveals China's success in COVID-19 response, economic development as well as economic and social development.


